
The release of 2010 Census data earlier this year may have been a gut-check for Jackson's leaders, but the numbers were hardly surprising. News reports, however, were quick to seize on them: Jackson's population dropped 5.8 percent over the last decade, from 184,256 in 2000 to 173,514 in 2010. Meanwhile, the five-county metropolitan statistical area--which includes Copiah, Hinds, Madison, Rankin and Simpson counties--grew 8.4 percent.
The city lost 19,485 white residents from 2000 to 2010, even as it added 7,976 black residents. For all the furor over the new census numbers, you'd think that this was surprising news. The truth is, the census numbers help tell a familiar story, but they also provide some interesting insights.
The population loss of the last decade was actually slower than the previous one. From 1990 to 2000, the capital city shed 6.3 percent of its residents. The 1990s were especially hard for the city; by comparison, the 1980s saw only a 3.1 percent population decrease.
The '90s also saw the most dramatic shifts in the city's racial balance. From 1980 to 1990, the proportion of Jackson's white population dropped from 52 percent to 43 percent. Then from 1990 to 2000, nearly 35,000 white residents left the city. Whites went from making up almost half of the city's population to a little more than a quarter. The past decade actually represents a slowing of that trend, albeit a slight one.
Some of the most illuminating trends in census data actually come from the American Community Survey, which the Census Bureau uses to collect detailed demographic information on housing, income and family structure. US2010, a project led by Brown University sociology professor John Logan, maps census and ACS data from as far back as 1940 onto census tracts of roughly 4,500 residents each.
US2010's online maps, which are accessible to everyone at s4.brown.edu/mapusa/, paint a detailed picture of Jackson's evolution. Take the city's Census Tract 4, which includes portions of north Fondren and Broadmoor, from Cedarhurst Drive to Meadowbrook Road. In 1980, the area was more than 95 percent white. Its poverty rate was between 3 and 6 percent, and between 70 and 80 percent of the neighborhood's homes were owner-occupied. Under half the households in the area had lived there fewer than 10 years.
By 1990, 5 percent to 10 percent of the census tract was black. These largely new black residents had a median income that was at or above the median income for whites in the neighborhood. Poverty and homeownership numbers remained the same, and median home values had risen slightly.
A decade later, the area's racial balance was approaching even, with both whites and African Americans making up between 30 percent and 50 percent of the population. Homeownership figures remained the same, and median home values had soared to between $200,000 and $250,000. But the area's poverty rate had doubled, or more. Now the median household income for white residents was above the median for the neighborhood as a whole. The figure for African Americans, on the other hand, was below the overall median.
By the most recent American Community Survey, from 2005 to 2009, the area's population was majority African American. Median income was slightly higher for all groups, though the figure for African American residents was still slightly lower than the number for whites. With the collapse of the housing bubble, median home values dropped by half or more. The area's population appeared to be newer, with 65 to 70 percent arriving since 2000 and owner occupancy down to between 60 and 70 percent.
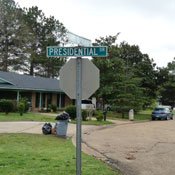
In other parts of the city, profound demographic changes happened long ago. Census Tract 103.01, which includes the Presidential Hills neighborhood, saw its racial demographics shift dramatically in the 1970s. The tract--bordered by Cynthia Road, Northside Drive and Medgar Evers Boulevard--was between 80 and 90 percent white in 1970. By 1980, it was majority black, with whites making up less than 30 percent of the area's population. Since that time, median household income has trended slowly upward. The area's poverty rate peaked at between 25 and 30 percent in 1990 and has dropped steadily since then. Median home values rose gradually from 1970 to 2000 but reached a plateau with the 2005-2009 ACS.
Previous Commentsshow
What's this?More like this story
More stories by this author
Support our reporting -- Follow the MFP.

Comments
Use the comment form below to begin a discussion about this content.